Classifiers
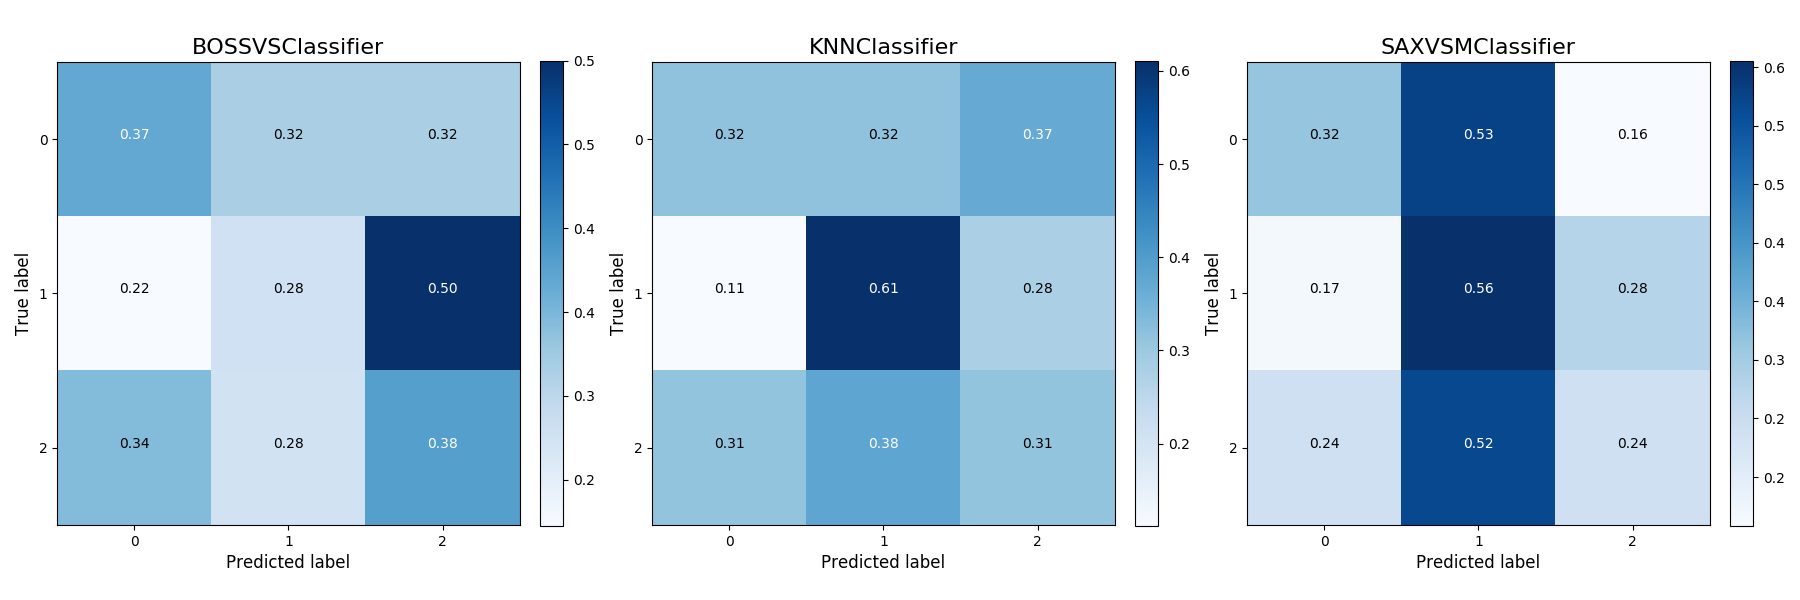
This example shows how to use the classifiers from pyts.classification.
If you are familiar with scikit-learn classifiers, it is straightforward. The
confusion matrix for each classifier is also plotted.

import numpy as np
import matplotlib.pyplot as plt
from itertools import product
from sklearn.metrics import confusion_matrix
from sklearn.model_selection import train_test_split
from pyts.classification import (BOSSVSClassifier, SAXVSMClassifier,
                                 KNNClassifier)

# Parameters
n_samples, n_features = 200, 144
n_classes = 3

# Toy dataset
rng = np.random.RandomState(41)
X = rng.randn(n_samples, n_features)
y = rng.randint(n_classes, size=n_samples)

# Train/test split
X_train, X_test, y_train, y_test = train_test_split(
    X, y, test_size=0.33, random_state=4141)

# BOSSVSClassifier
bossvs = BOSSVSClassifier(n_coefs=4, window_size=24)
bossvs.fit(X_train, y_train)
y_pred_boss = bossvs.predict(X_test)

# SAXVSMClassifier
saxvsm = SAXVSMClassifier()
saxvsm.fit(X_train, y_train)
y_pred_saxvsm = saxvsm.predict(X_test)

# KNNClassifier
knn = KNNClassifier()
knn.fit(X_train, y_train)
y_pred_knn = knn.predict(X_test)

# Confusion matrices
cm_boss = confusion_matrix(y_test, y_pred_boss)
cm_boss = cm_boss.astype('float') / cm_boss.sum(axis=1)[:, np.newaxis]

cm_saxvsm = confusion_matrix(y_test, y_pred_saxvsm)
cm_saxvsm = cm_saxvsm.astype('float') / cm_saxvsm.sum(axis=1)[:, np.newaxis]

cm_knn = confusion_matrix(y_test, y_pred_knn)
cm_knn = cm_knn.astype('float') / cm_knn.sum(axis=1)[:, np.newaxis]

dictionary = {"BOSSVSClassifier": cm_boss,
              "SAXVSMClassifier": cm_saxvsm,
              "KNNClassifier": cm_knn}

# Plot confusion matrices
plt.figure(figsize=(18, 6))
for idx, (title, cm) in zip(range(1, 4), dictionary.items()):
    plt.subplot(130 + idx)
    plt.imshow(cm, interpolation='nearest', cmap=plt.cm.Blues)
    thresh = (cm.max() + cm.min()) / 2.
    for i, j in product(range(cm.shape[0]), range(cm.shape[1])):
        plt.text(j, i, format(cm[i, j], '0.2f'),
                 horizontalalignment="center",
                 color="white" if cm[i, j] > thresh else "black")
    plt.colorbar(fraction=0.046, pad=0.04, format='%.1f')
    plt.title(title, fontsize=16)
    tick_marks = np.arange(n_classes)
    plt.xticks(tick_marks, tick_marks)
    plt.yticks(tick_marks, tick_marks)
    plt.tight_layout()
    plt.ylabel('True label', fontsize=12)
    plt.xlabel('Predicted label', fontsize=12)
plt.show()
Total running time of the script: ( 0 minutes 1.117 seconds)