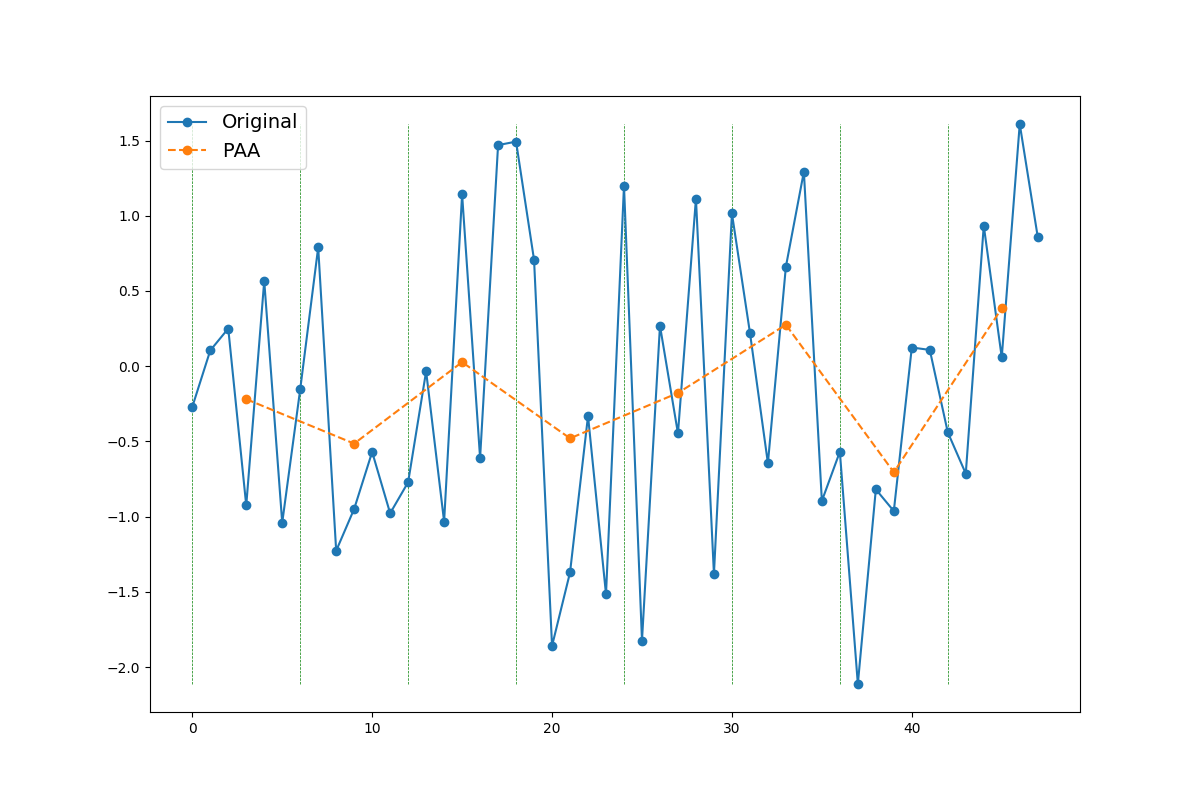
Piecewise Aggregate Approximation
This example shows how you can approximate a time series using
pyts.approximation.PAA.
import numpy as np
import matplotlib.pyplot as plt
from pyts.approximation import PAA

# Parameters
n_samples, n_features = 100, 48

# Toy dataset
rng = np.random.RandomState(41)
X = rng.randn(n_samples, n_features)

# PAA transformation
window_size = 6
paa = PAA(window_size=window_size)
X_paa = paa.transform(X)

# Show the results for the first time series
plt.figure(figsize=(12, 8))
plt.plot(np.arange(n_features), X[0], 'o-', label='Original')
plt.plot(np.arange(window_size // 2,
                   n_features + window_size // 2,
                   window_size), X_paa[0], 'o--', label='PAA')
plt.vlines(np.arange(0, n_features, window_size),
           X[0].min(), X[0].max(), color='g', linestyles='--', linewidth=0.5)
plt.legend(loc='best', fontsize=14)
plt.show()
Total running time of the script: ( 0 minutes 0.040 seconds)