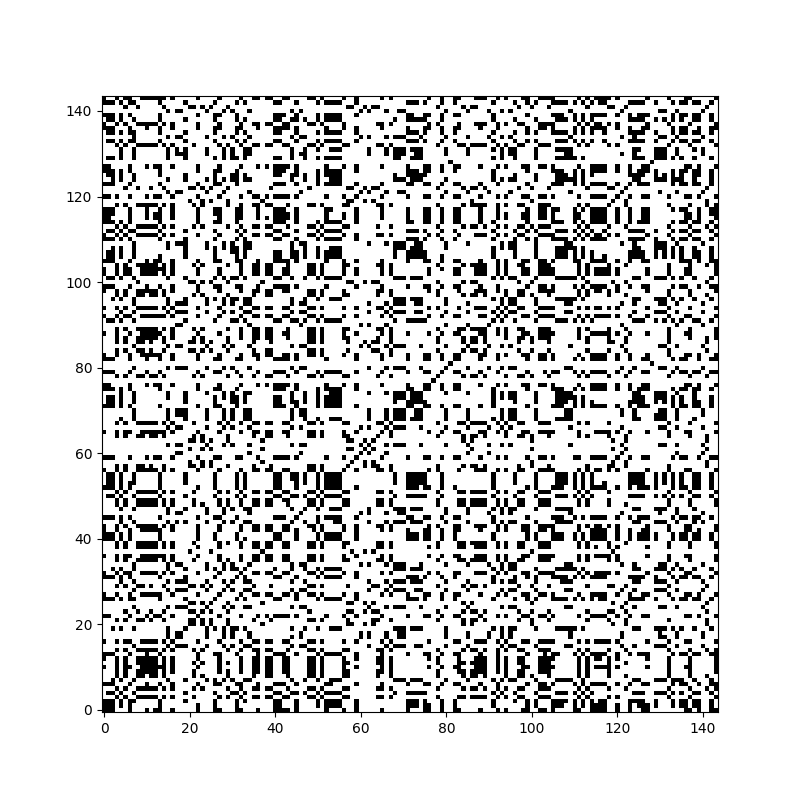
Recurrence Plots
This example shows how you can transform a time series into a Recurrence Plot
using pyts.image.RecurrencePlots.
import numpy as np
import matplotlib.pyplot as plt
from pyts.image import RecurrencePlots

# Parameters
n_samples, n_features = 100, 144

# Toy dataset
rng = np.random.RandomState(41)
X = rng.randn(n_samples, n_features)

# Recurrence plot transformation
rp = RecurrencePlots(dimension=1,
                     epsilon='percentage_points',
                     percentage=30)
X_rp = rp.fit_transform(X)

# Show the results for the first time series
plt.figure(figsize=(8, 8))
plt.imshow(X_rp[0], cmap='binary', origin='lower')
plt.show()
Total running time of the script: ( 0 minutes 0.099 seconds)