Plotting a time series
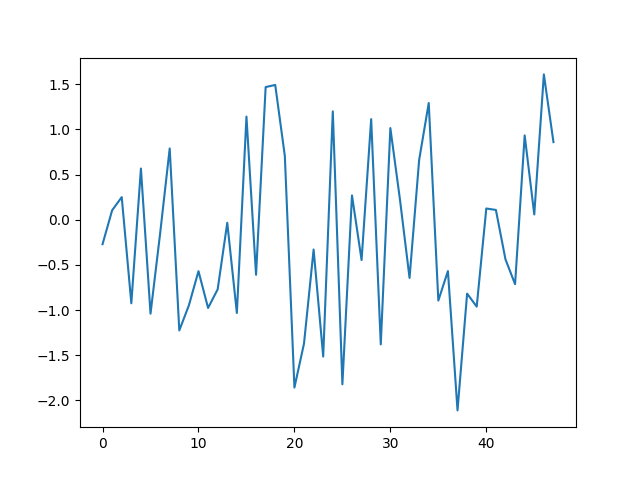
This example shows how you can plot a single time series.
import numpy as np
import matplotlib.pyplot as plt

# Parameters
n_samples, n_features = 100, 48

# Toy dataset
rng = np.random.RandomState(41)
X = rng.randn(n_samples, n_features)

# Plot the first time series
plt.plot(X[0])
plt.show()
Total running time of the script: ( 0 minutes 0.064 seconds)